Thursday, June 26, 2008
Existing Home Sales: Not Seasonally Adjusted
by CalculatedRisk
 Click on graph for larger image in new window.
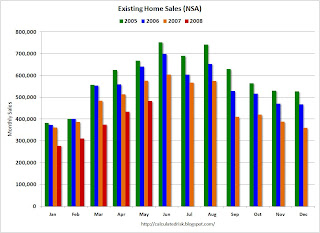
This graph shows Not Seasonally Adjusted (NSA) existing home sales for 2005 through 2008. Sales are sharply lower in May 2008 compared to the previous three years.
May is an important month for existing home sales, and marks the beginning of the Summer selling season.
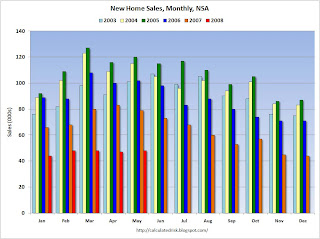
Let's compare the NSA pattern for existing home sales to the pattern for new home sales. The second graph shows monthly NSA new home sales.
The first difference is that new home sales peak in the Spring, and existing home sales peak in the Summer. This is because new home sales are reported when the contract is signed, and existing home sales are reported at the close of escrow.
The second obvious difference is there was no Spring selling season for New Home sales, but there has been a pickup (although muted) in Existing Home sales.
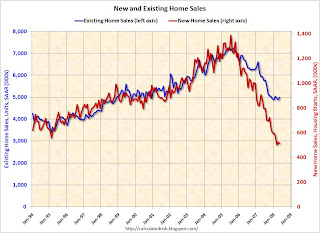
The difference in sales activity could partly be because new homes tend to be in more remote locations, and with rising fuel prices, home buyers are buying existing homes closer to their places of work. Another explanation is that existing home sales are being boosted by REO (bank Real Estate Owned) sales. Dataquick reported that in California in May, 38.3 percent of all sales were foreclosure resales!  The third graph compares New Home sales vs. Existing Home sales since January 1994.
Clearly new home sales have fallen faster than existing home sales.
I suspect REO resales explain some of the difference (as does location).
No comments:
Post a Comment